AI ディレクトリ : AI Charting
What is vizGPT?
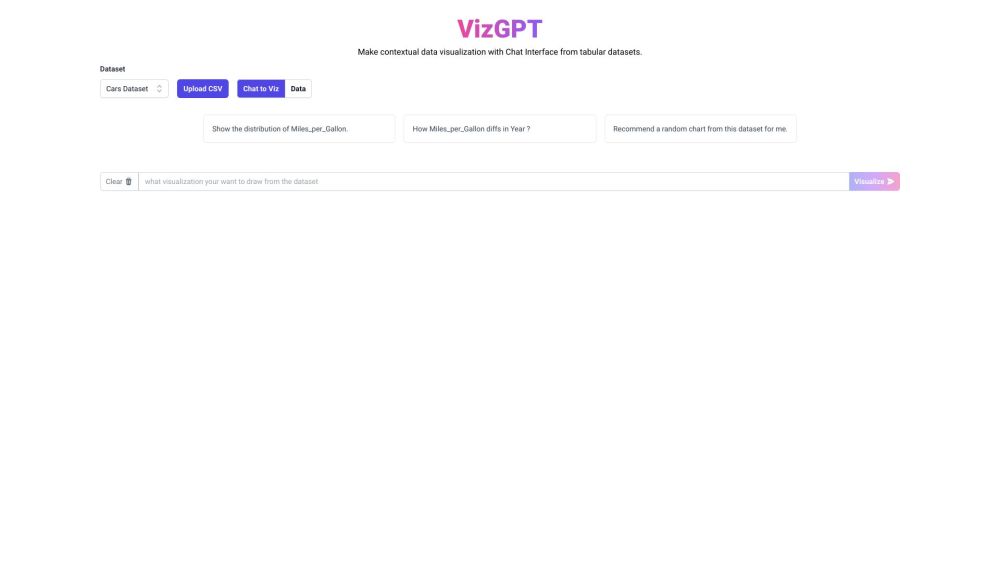
VizGPT is a data visualization platform with a chat interface, designed to transform contextual data into interactive visual charts. It leverages advanced models such as chartGPT, vizGPT, text2viz, and text2chart to generate meaningful visual representations from textual input.
How to use vizGPT?
To use VizGPT, simply input your contextual data into the chat interface and engage in a conversation. VizGPT will interpret your text and generate interactive visualizations based on the provided information. You can further refine and customize the visualizations by specifying chart types, desired dimensions, colors, and labels.
vizGPT's Core Features
Key features of VizGPT include: - Contextual data visualization through natural language processing - Interactive visual charts based on advanced models - Customization options for chart types, dimensions, colors, and labels - Seamless chat interface for intuitive communication - Real-time updates and adjustments to visualizations as the conversation progresses
vizGPT's Use Cases
VizGPT can be used in various scenarios, including: - Analyzing and visualizing data from business reports - Creating visual representations of survey responses - Exploring trends and patterns in social media discussions - Converting textual research findings into graphical presentations - Assisting in decision-making processes by providing visual insights
vizGPT Support Email & Customer service contact & Refund contact etc.
Here is the vizGPT support email for customer service: [email protected] .
vizGPT Company
vizGPT Company name: Kanaries Data, Inc. .
vizGPT Login
vizGPT Login Link: https://vizgpt.ai/signin
vizGPT Pricing
vizGPT Pricing Link: https://vizgpt.ai/pricing
vizGPT Github
vizGPT Github Link: https://github.com/Kanaries
FAQ from vizGPT
What is vizGPT?
VizGPT is a data visualization platform with a chat interface, designed to transform contextual data into interactive visual charts. It leverages advanced models such as chartGPT, vizGPT, text2viz, and text2chart to generate meaningful visual representations from textual input.
How to use vizGPT?
To use VizGPT, simply input your contextual data into the chat interface and engage in a conversation. VizGPT will interpret your text and generate interactive visualizations based on the provided information. You can further refine and customize the visualizations by specifying chart types, desired dimensions, colors, and labels.
What types of visualizations can VizGPT generate?
VizGPT can generate a wide range of visualizations, including bar charts, line charts, pie charts, scatter plots, and more. The choice of visualization type depends on the nature of the data and the insights you wish to convey.
Can I customize the appearance of the visual charts?
Yes, VizGPT allows you to customize the appearance of visual charts. You can specify dimensions, colors, and labels to suit your preferences and requirements.
Is real-time visualization possible with VizGPT?
Yes, VizGPT supports real-time updates to visualizations. As the conversation progresses or new data is provided, the visual charts are automatically adjusted to reflect the updated information.
What kind of data can I visualize using VizGPT?
VizGPT can visualize various types of data, including numerical data, categorical data, and textual data. It can interpret and transform contextual information from text into meaningful visual representations.
Can VizGPT handle large datasets?
VizGPT is designed to handle diverse datasets, ranging from small to large. However, the performance may vary depending on the complexity and size of the data.