AI Directory : AI Charting, AI Presentation Generator, AI Product Description Generator, AI Spreadsheet
What is GRID?
GRID is a smart spreadsheet surface that syncs with and visualizes data from spreadsheets and databases. It provides a familiar spreadsheet interface with powerful integrations for Notion and Airtable.
How to use GRID?
To use GRID, start by building or connecting a spreadsheet or data source. Then, select the data you want to visualize and add interactivity using the built-in spreadsheet editor. GRID allows you to combine data from different sources into one chart and embed your work in websites or internal wikis.
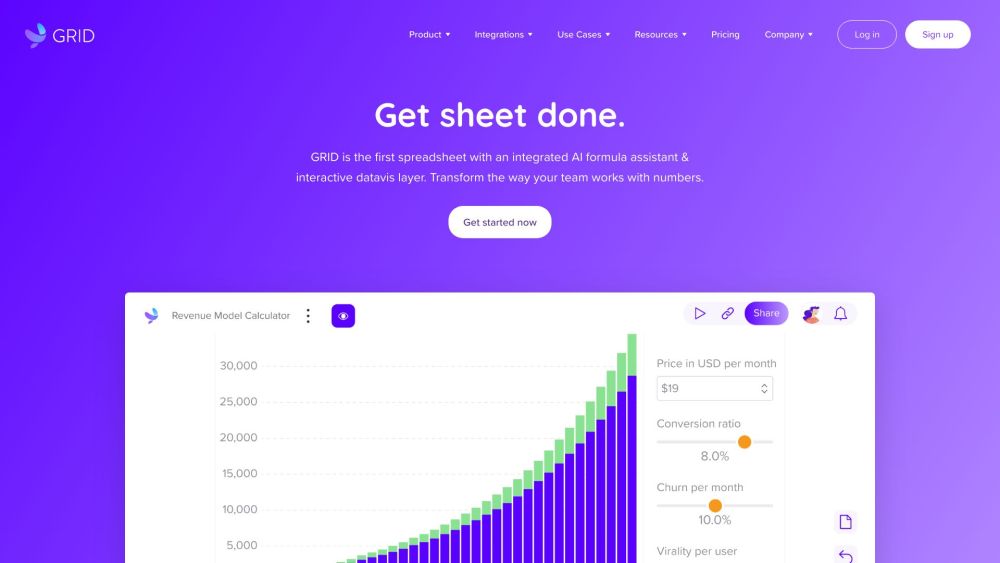
GRID's Core Features
Syncs with and visualizes data from spreadsheets and databases
Built-in spreadsheet editor with familiar formulas
Powerful integrations for Notion and Airtable
Interactive projections and visualizations
Combine data from different sources into one chart
Embed work in websites and internal wikis
AI Formula Assistant for instant formula suggestions
AI Chart Assistant for smart chart help
GRID's Use Cases
Building powerful business calculators
Creating dynamic financial models
Building interactive reports and dashboards for marketing and sales
Analyzing campaign performance and tracking KPIs
Creating interactive financial reports
Forecasting and projecting revenue
Presenting data beautifully
GRID Support Email & Customer service contact & Refund contact etc.
Here is the GRID support email for customer service: [email protected] .
GRID Company
GRID Company name: GRID .
More about GRID, Please visit the about us page(https://grid.is/company?utm_seq=1&utm_firstpage=%2Findex).
GRID Login
GRID Login Link: https://grid.is/user/login?utm_seq=1&utm_firstpage=%2Findex
GRID Sign up
GRID Sign up Link: https://grid.is/user/login?signup=email&utm_seq=1&utm_firstpage=%2Findex
GRID Pricing
GRID Pricing Link: https://grid.is/product/pricing?utm_seq=1&utm_firstpage=%2Findex
GRID Facebook
GRID Facebook Link: https://www.facebook.com/gridmakers/
GRID Youtube
GRID Youtube Link: https://www.youtube.com/@GRID_hq
GRID Linkedin
GRID Linkedin Link: https://www.linkedin.com/company/gridmakers/
GRID Twitter
GRID Twitter Link: https://twitter.com/GRID_hq
FAQ from GRID
What is GRID?
GRID is a smart spreadsheet surface that syncs with and visualizes data from spreadsheets and databases. It provides a familiar spreadsheet interface with powerful integrations for Notion and Airtable.
How to use GRID?
To use GRID, start by building or connecting a spreadsheet or data source. Then, select the data you want to visualize and add interactivity using the built-in spreadsheet editor. GRID allows you to combine data from different sources into one chart and embed your work in websites or internal wikis.
What does GRID do?
GRID is a smart spreadsheet that syncs with and visualizes data from spreadsheets and databases. It allows users to explore interactive analysis, build beautiful reports, collaborate with ease, and make fast, data-driven decisions.
How do I use GRID?
To use GRID, start by building or connecting a spreadsheet or data source. Then, select the data you want to visualize and add interactivity using the built-in spreadsheet editor. GRID allows you to combine data from different sources into one chart and embed your work in websites or internal wikis.
What are the core features of GRID?
GRID's core features include syncing with and visualizing data from spreadsheets and databases, a built-in spreadsheet editor with familiar formulas, powerful integrations for Notion and Airtable, interactive projections and visualizations, the ability to combine data from different sources into one chart, and the option to embed work in websites and internal wikis. It also includes AI assistants for instant formula suggestions and smart chart help.
What are some use cases for GRID?
Some use cases for GRID include building powerful business calculators, creating dynamic financial models, building interactive reports and dashboards for marketing and sales, analyzing campaign performance and tracking KPIs, creating interactive financial reports, and forecasting and projecting revenue.