AI Directory : AI Charting
What is Chartify?
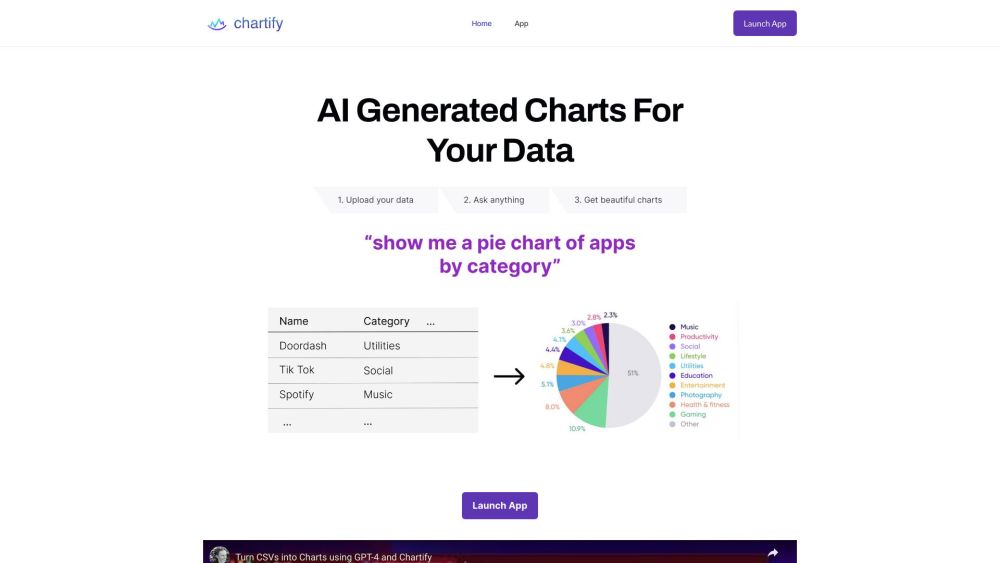
Chartify is an AI-generated charting tool that allows users to turn CSVs and database tables into rich, interactive charts and graphs. It offers a new way to visualize data, providing AI-recommended visualizations and allowing users to ask for specific chart types.
How to use Chartify?
To use Chartify, follow these steps: 1. Upload your data by either uploading a CSV file or connecting to a Postgres or MySQL database. 2. Get recommended visualizations, which will be generated by the AI based on your data. 3. Ask for specific charts by specifying your desired chart type, such as a stacked bar chart of revenue growth by product line over the last 20 years.
Chartify's Core Features
AI-generated visualizations
Support for CSV files and database connections
Wide range of charting options, including pie charts, line graphs, bar charts, and more
Integration with Plotly, Matplotlib, Seaborn, and Charts.js
Chartify's Use Cases
Data analysis
Data visualization
Reporting
Presentations
Business intelligence
FAQ from Chartify
What is Chartify?
Chartify is an AI-generated charting tool that allows users to turn CSVs and database tables into rich, interactive charts and graphs. It offers a new way to visualize data, providing AI-recommended visualizations and allowing users to ask for specific chart types.
How to use Chartify?
To use Chartify, follow these steps:n1. Upload your data by either uploading a CSV file or connecting to a Postgres or MySQL database.n2. Get recommended visualizations, which will be generated by the AI based on your data.n3. Ask for specific charts by specifying your desired chart type, such as a stacked bar chart of revenue growth by product line over the last 20 years.
What types of data sources does Chartify support?
Chartify supports CSV files, as well as connections to Postgres and MySQL databases.
Can I ask for specific chart types?
Yes, Chartify allows you to ask for specific chart types, such as a stacked bar chart of revenue growth by product line over the last 20 years.
Which charting libraries does Chartify integrate with?
Chartify integrates with Plotly, Matplotlib, Seaborn, and Charts.js, allowing you to leverage their charting functionalities.
What kind of users can benefit from using Chartify?
Chartify is beneficial for users in various domains, including data analysis, data visualization, reporting, presentations, and business intelligence.